-
In
chevron_right
La parole à… Nicolas Marques, directeur général de l’Institut Molinari – « L’Agirc-Arrco aurait vocation à gérer un système par capitalisation »
tests.marevalo.net / Institut economique Molinari · Thursday, 26 January, 2023 - 20:29
- group_work rss_feed
-
In
chevron_right
Réforme des retraites: et si les séniors passaient à la caisse?
Institut économique Molinari · tests.marevalo.net / Institut economique Molinari · Friday, 13 January, 2023 - 16:13
-
In
chevron_right
Retraites : généraliser la capitalisation collective et provisionner
Institut économique Molinari · tests.marevalo.net / Institut economique Molinari · Thursday, 12 January, 2023 - 16:10
-
In
chevron_right
Pourquoi la réforme des retraites est-elle nécessaire?
Institut économique Molinari · tests.marevalo.net / Institut economique Molinari · Tuesday, 20 December, 2022 - 15:11
-
In
chevron_right
Le coût excessif du logement nuit au pouvoir d’achat
Institut économique Molinari · tests.marevalo.net / Institut economique Molinari · Monday, 19 December, 2022 - 10:30 · 17 minutes
- Libérer la constructibilité du foncier en changeant la philosophie des Plans locaux d’urbanisme
- Créer un droit de pétition au profit des propriétaires bloqués par le Plan local d’urbanisme
-
In
chevron_right
In search of lost purchasing power – Chapter 4: Lack of pension diversification hurts purchasing power
Institut économique Molinari · tests.marevalo.net / Institut economique Molinari · Friday, 16 December, 2022 - 15:18 · 23 minutes
- Set up collective capitalization for all private sector employees, on the model of what has existed in the public sector since 2005 with the ERAFP.
- Making pay-as-you-go or tax-financed pensions more reliable
- Improving the retirement savings component of the PACTE law
-
In
chevron_right
Retraites : François Bayrou rédige enfin une note utile
Institut économique Molinari · tests.marevalo.net / Institut economique Molinari · Tuesday, 13 December, 2022 - 17:25
-
In
chevron_right
Comment les impôts et les normes amputent le pouvoir d’achat des Français
Institut économique Molinari · tests.marevalo.net / Institut economique Molinari · Tuesday, 13 December, 2022 - 17:23
-
In
chevron_right
A la recherche du pouvoir d’achat perdu – Quand des politiques publiques nuisent au pouvoir d’achat
Institut économique Molinari · tests.marevalo.net / Institut economique Molinari · Tuesday, 13 December, 2022 - 13:59 · 3 minutes
L’article Réforme des retraites: et si les séniors passaient à la caisse? est apparu en premier sur Institut économique Molinari .
L’article Retraites : généraliser la capitalisation collective et provisionner est apparu en premier sur Institut économique Molinari .
L’article Pourquoi la réforme des retraites est-elle nécessaire? est apparu en premier sur Institut économique Molinari .
Le constat : Les ménages français sont victimes d’un spirale inflationniste nourrie par les prix du foncier.
L’enjeu : Assouplir le droit foncier pour améliorer le pouvoir d’achat.
———————–
Par rapport à l’UE, un surcoût annuel de 1 100 euros pour un ménage moyen
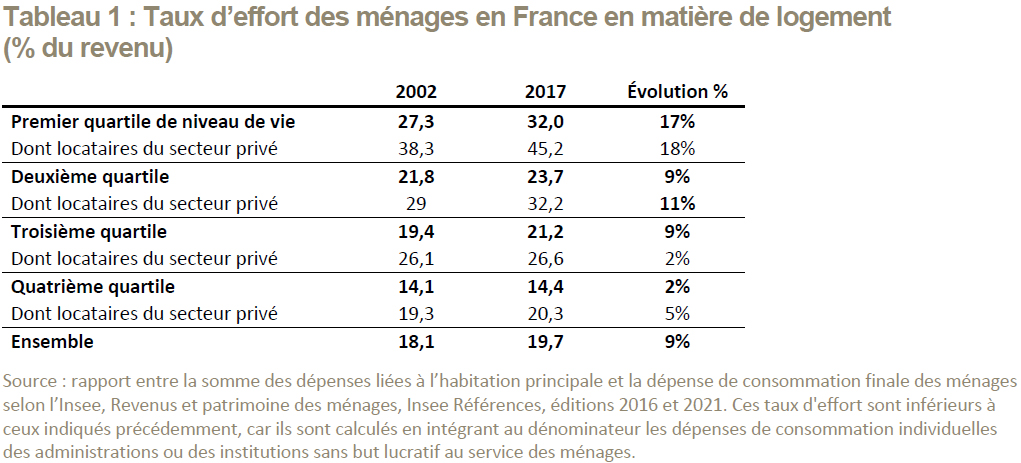
Les prix du logement sont la cause d’un appauvrissement de la population. Le poids du logement dans le budget des ménages est passé en moyenne de 11 % des dépenses de consommation finale des ménages en 1959 à 28 % en 2021 [i] , cette augmentation pesant davantage sur le taux d’effort des ménages modestes (Tableau 1).
Les rapports de la Fondation Abbé Pierre [ii] signalent, chaque année, une dégradation de la situation des ménages les plus pauvres par rapport au logement, le nombre de personnes sans domicile fixe (SDF) ayant été multiplié par 3 depuis 2006, et le nombre de ménages en logement frappé de vétusté par 2.
Les conséquences économiques et sociales du renchérissement du logement sur la société ne s’arrêtent pas là. Une note du Conseil d’analyse économique de 2013 souligne que « la hausse des prix conduit à des inefficacités économiques : elle éloigne certains travailleurs des zones d’emploi, de sorte que les trajets domicile-travail s’allongent et que certaines offres d’emploi restent non pourvues » [iii] .
Ce même travail souligne aussi que le renchérissement du logement est un facteur de creusement des inégalités patrimoniales, notamment intergénérationnelles : « la hausse des prix (du logement) est anti-redistributive (…). Elle constitue un transfert des jeunes générations vers les plus anciennes, déjà propriétaires, et les ménages jeunes modestes se trouvent très pénalisés dans l’accession à la propriété ».
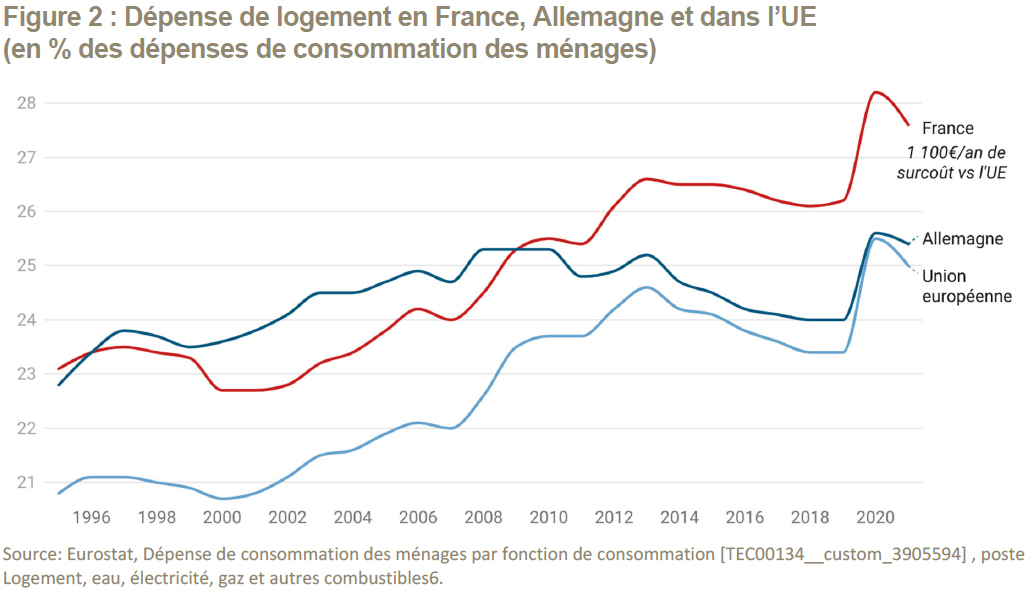
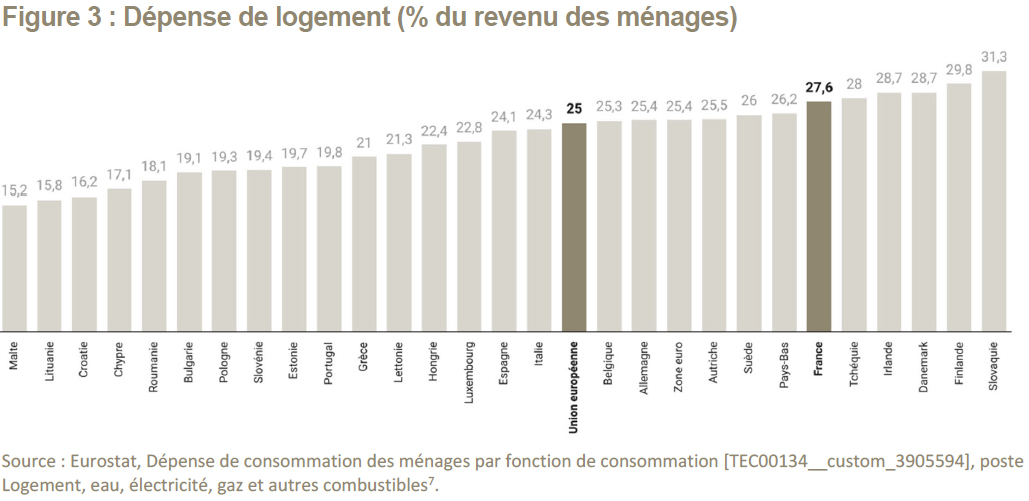
Si l’augmentation tendancielle du coût du logement est un phénomène global, elle pèse plus largement sur les ménages français (Figure 2). Les comparaisons européennes montrent que se loger coûte 2,6 % de plus du revenu en France par rapport à la moyenne de l’Union européenne (Figure 3), soit un surcoût de 1 100 euros par an et par ménage [iv] .
L’explosion des prix du logement par rapport aux revenus des ménages constitue un problème économique et social majeur. En reconnaissant la cause foncière du phénomène, il serait possible de redonner du pouvoir d’achat aux ménages.
L’explosion de la demande de logement ne suffit pas à expliquer celle des prix
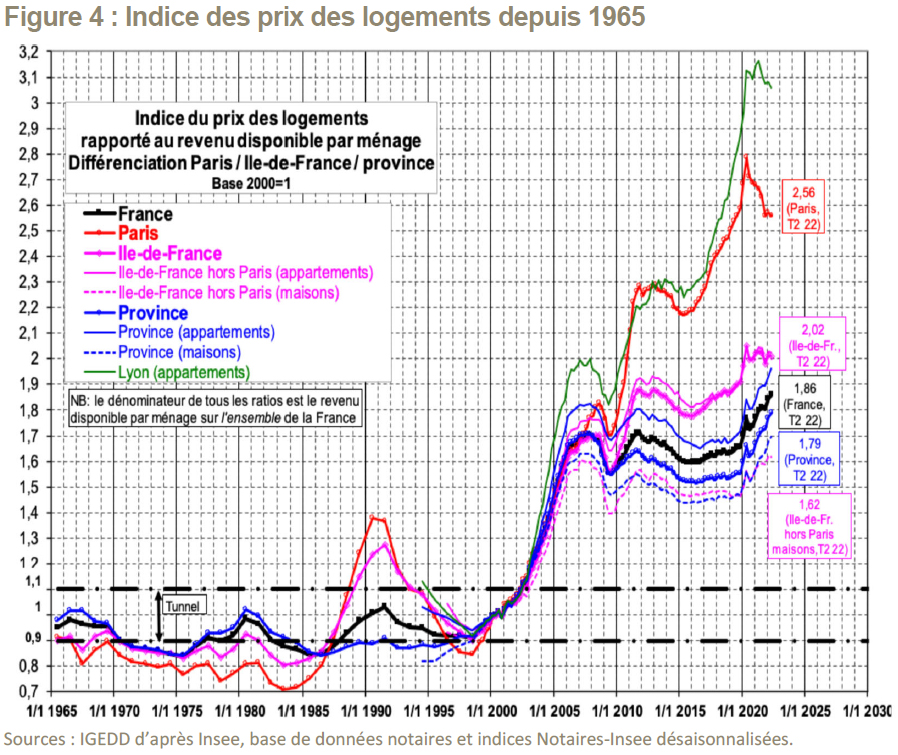
En 1997, le prix médian du logement en France, selon l’Insee, était de 77 100 euros, soit 105 900 euros de 2019. Or, le prix médian constaté en 2019, avant pandémie, était de 209 000 euros, soit un quasi doublement en euros courants. D’après les statistiques officielles du ministère du logement [vii] (Figure 4), depuis le début du siècle, les prix ont augmenté en moyenne 86 % plus rapidement que le revenu des ménages, et même 156 % plus vite à Paris. Grandes villes mises à part, cette augmentation concerne la période 1997-2008.
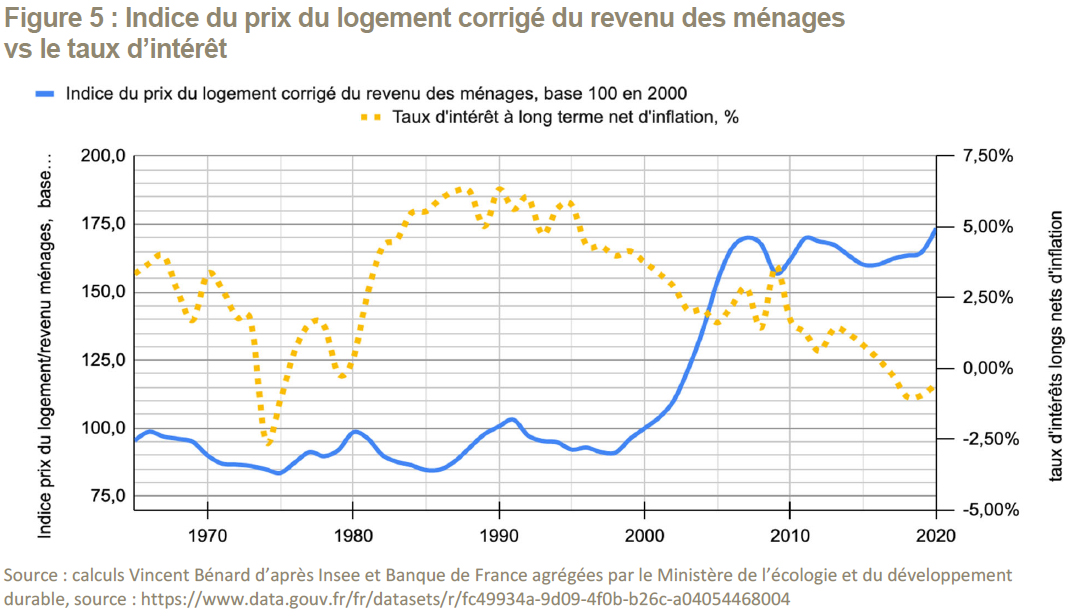
De nombreux analystes notent que 1997 a marqué, un peu partout dans le monde, le point de départ d’une spectaculaire baisse des taux d’intérêt des prêts immobiliers. Cette chute des taux a solvabilisé la demande et suffirait à expliquer la hausse des prix immobiliers observée dans de nombreux pays. Cette explication paraît néanmoins simpliste car un choc de demande se résorbe à moyen terme, sauf contraintes physiques et réglementaires, par une augmentation de l’offre et nombre de données indiquent que ce choc n’a pas partout conduit à des hausses de prix.
Dans le cas de la France par exemple (Figure 5). En dépit de variations de taux considérables depuis 1965, le lien entre baisse des taux et explosion des prix immobiliers ne se vérifie qu’entre 1997 et 2007. La période précédente était marquée par une relative stabilité des prix malgré des variations de taux tout aussi marquées.
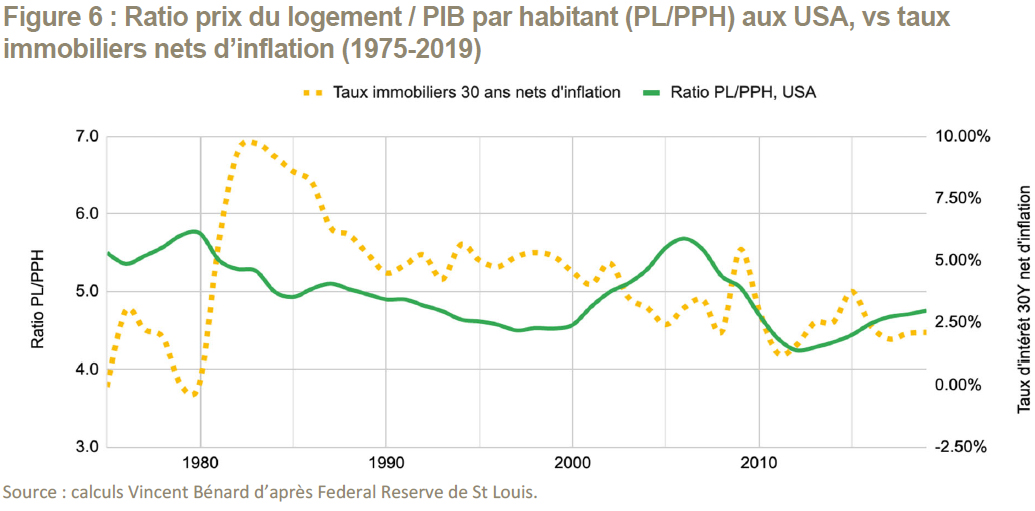
Le phénomène se vérifie aussi aux Etats-Unis [viii] où seule la période 2000-2006 indique une relation entre baisse des taux et hausse des prix. La période 1983-1990 indique, en dépit d’une très forte baisse des taux, une baisse des prix par rapport au PIB (Figure 6).
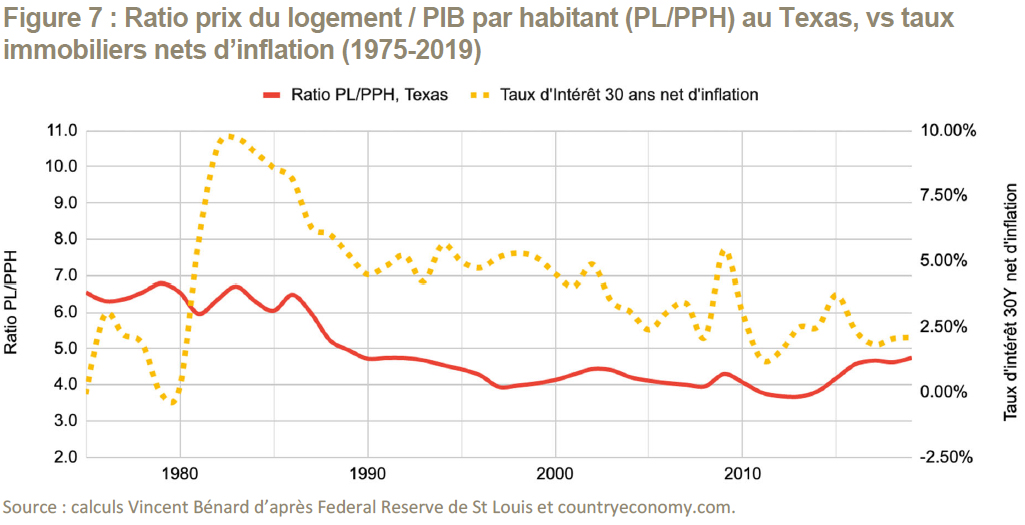
Dans le cas de l’Etat du Texas, dont l’augmentation de population a été la plus forte des USA (+78 % entre 1985 et 2020), la très forte demande de logement associée à la baisse des taux d’intérêt observée dans le reste du monde s’accompagne, à l’inverse, d’une baisse des prix du logement rapportés à la richesse produite quasi continue entre 1987 et 2013 (Figure 7). La bulle observée sur l’indice américain entre 2000 et 2006 n’apparait même pas sur la courbe des prix texans.
En conclusion, si les taux d’intérêt jouent bien un rôle dans la formation des prix immobiliers, ils ne peuvent pas en être l’unique facteur.
Les réglementations du foncier alimentent la flambée des prix du logement
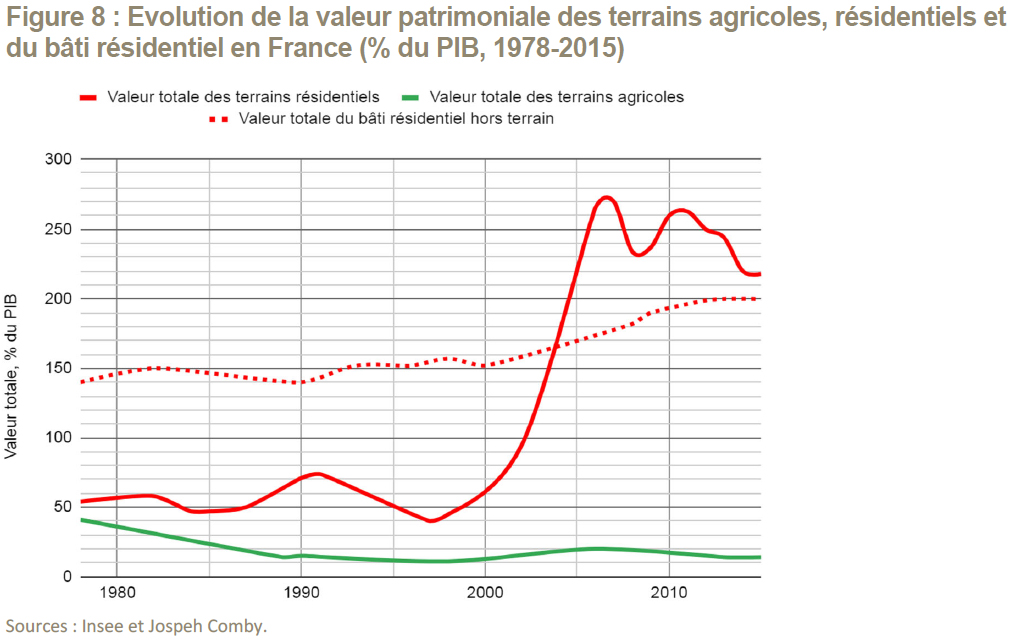
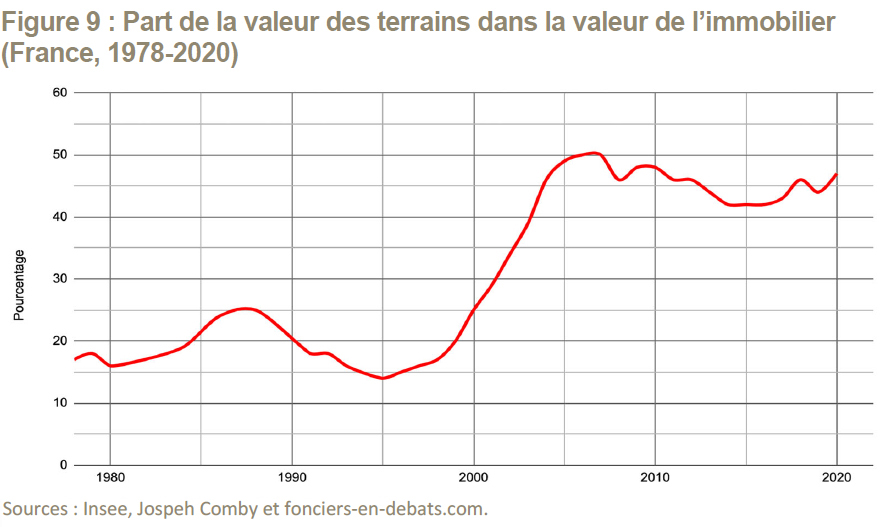
Tout bien immobilier se décompose entre sa part foncière et sa part bâtie. En observant, à partir des données de l’Insee, l’évolution de ces deux composantes (Figure 8), les économistes Joseph Comby et Jean Cavailhès [ix] constatent qu’elles divergent fortement à partir de la fin des années 1990.
Entre 1998 et 2008, la valeur du bâti résidentiel français (exprimée par rapport au PIB) augmente de 17 %, alors que la valeur du foncier résidentiel explose de 40 à 270 % du PIB, soit une augmentation de 575 % [x] . Si le taux d’intérêt était la seule variable de contrôle des prix de l’immobilier, une telle divergence ne serait pas possible.
Comby et Cavailhès ont également calculé (Figure 9) que la part de la valeur des terrains dans l’immobilier résidentiel avait explosé entre 1997 et 2008, passant de 15 à 50 %, pour se stabiliser ensuite autour de 45% [xi] . En rapportant ces pourcentages au prix payé par les ménages pour leur logement, il apparait que le prix des terrains, corrigé du revenu des ménages, a été multiplié par 6 dans cette période.
Le foncier n’est pourtant pas physiquement rare en France, pays globalement plat et dont moins de 6 % du territoire est urbanisé à ce jour. Les deux auteurs forment donc l’hypothèse que les réglementations foncières ont empêché l’offre de foncier résidentiel de s’adapter à l’évolution de la demande foncière.
Le cas des Etats-Unis offre la possibilité de vérifier cette hypothèse dans la mesure où le droit du sol y est régi de manière différente d’un Etat à l’autre, à la différence de la France où le droit des sols est uniforme sur tout le territoire.
Ainsi, le sol peut y être régi, selon l’Etat, [xii] soit par un « droit restrictif » [xiii] nécessitant que la constructibilité d’un terrain soit accordée par le pouvoir politique avant de pouvoir déposer un permis de bâtir, soit par un « droit réactif » postulant que c’est la limitation du droit à construire qui doit faire l’objet d’une décision politique démocratiquement encadrée [xiv] . Dans le 2 ème cas, « construire est facile, l’empêcher est difficile », alors que dans le 1 er , c’est tout l’inverse.
Le milieu académique américain a abondamment étudié l’influence de ces deux types de législation sur les prix immobiliers. Parmi eux, Ed Glaeser (Harvard) et Joseph Gyourko (Wharton), ont établi dès 2002 [xv] que la variable qui faisait évoluer significativement la volatilité des prix du foncier était la sévérité de sa réglementation. L’économiste indépendant Wendell Cox [xvi] a confirmé cette analyse en analysant sur plusieurs décennies l’évolution des prix et des revenus dans plus de 100 métropoles du monde anglophone en fonction de leur réglementation.
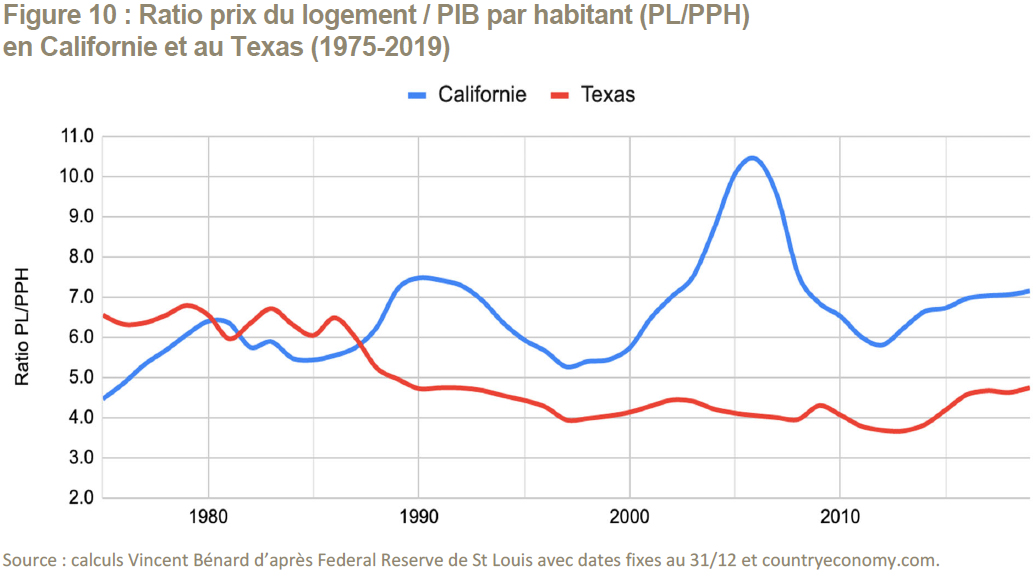
La comparaison entre la Californie et le Texas économiquement et démographiquement proches (15 millions d’habitants gagnés entre 1980 et 2020 pour chacun), illustre concrètement l’impact de chaque philosophie du droit des sols sur les prix immobiliers. La Californie a pratiquement inventé les droits du sol restrictifs modernes qu’elle a déployé au début des années 70 alors que le Texas les a interdits au tournant des années 80.
Au Texas, il faut entre 3,7 et 4,7 années de PIB par habitant pour acquérir un logement [xvii] , alors qu’il en faut entre 6 et 7 ans en Californie (et même 10 ans au sommet de la bulle, cf. Figure 10) [xviii] . Au Texas, les prix ont été très peu sensibles aux aléas conjoncturels, alors que la Californie a le plus souffert de l’éclatement de la bulle des « crédits subprime » en 2008 [xix] .
Ainsi, plus les réglementations limitent la possibilité de mobiliser du foncier constructible, plus les prix flambent lorsque les autres données conjoncturelles (démographie, économie, et taux d’intérêt) alimentent un surcroît de demande. Le prix Nobel d’économie Paul Krugman écrivait en 2005 qu’« au centre du pays, construire des maisons est facile. Quand la demande de logement augmente, les métropoles s’étendent juste un peu plus. Résultat, les prix du logement y sont basiquement déterminés par les coûts de construction » [xx] . Il ajoutait que dans ces Etats où l’expansion urbaine périphérique est peu contrainte, « une bulle immobilière ne peut tout simplement pas démarrer ».
Le droit des sols français toujours plus restrictif rogne le pouvoir d’achat
La France dispose d’un droit des sols restrictif que le législateur semble vouloir continuellement renforcer. Le document juridique qui détermine ce qui peut être construit et ce qui ne peut pas l’être, le Plan local d’urbanisme (PLU), doit être compatible avec des règles en constante évolution, qui ont pour effet d’empêcher toute adaptation rapide de l’offre de terrain constructible à la demande des ménages.
Ces lois existent depuis 1967 mais jusque dans les années 1990, elles touchaient essentiellement les grandes et moyennes métropoles. Il était possible de contourner la difficulté de bâtir dans les villes principales en construisant dans les zones périurbaines. Cet état de fait a changé avec la loi SRU de 2000, instaurant l’obligation de « lutter contre l’étalement urbain » sur tout le territoire dans le cadre de « Schémas de cohérence territoriaux » (SCOT), obéissant à des règles malthusiennes en termes d’ouverture de terrain à la construction. La mise en place très rapide des SCOT entre 2001 et 2005, et leur incidence sur la raréfaction de l’ouverture du foncier constructible, coïncide avec l’explosion des prix immobiliers.
Depuis la loi SRU, tous les gouvernements ont ajouté de nouvelles couches législatives (Lois Grenelle 1 et 2, ALUR, ELAN…) introduisant de nouvelles restrictions à justification environnementale. Dernièrement, la loi « Climat et Résilience » de 2021 a introduit l’objectif « Zéro artificialisation nette » (ZAN) d’ici 2050. L’application de cette doctrine limitera drastiquement les possibilités de construire. Elle s’accompagnera de prix immobiliers élevés, délétères pour le pouvoir d’achat en France, en particulier pour les ménages les plus modestes.
Si le coût de ces réglementations n’a pas été calculé pour la France, des données existent pour les Etats-Unis. Chang-Tai Hsieh et Enrico Moretti ont montré que le PIB pourrait augmenter significativement si les zones les plus productives des Etats-Unis (New York, Silicon Valley) devenaient plus accessibles [xxi] . Ils déterminent que les contraintes ont réduit la croissance de 36 % entre 1964 et 2009 en raison de la mauvaise allocation de la main-d’œuvre [xxii] . Si le foncier était plus libre, le PIB 2009 aurait plus élevé de 3,7 points, les réglementations malthusiennes représentant un manque-à-gagner de 3 685 dollars par personne.
Acheter un logement pourrait être de 20 à 40 % moins cher en France
Pour déterminer l’ampleur du surcoût du logement en France par rapport à ce qu’il pourrait être avec une réglementation différente, nous avons comparé l’évolution du ratio « Prix du Logement/PIB par habitant » avec la Californie et le Texas deux territoires économiquement et démographiquement comparables (Figure 11).
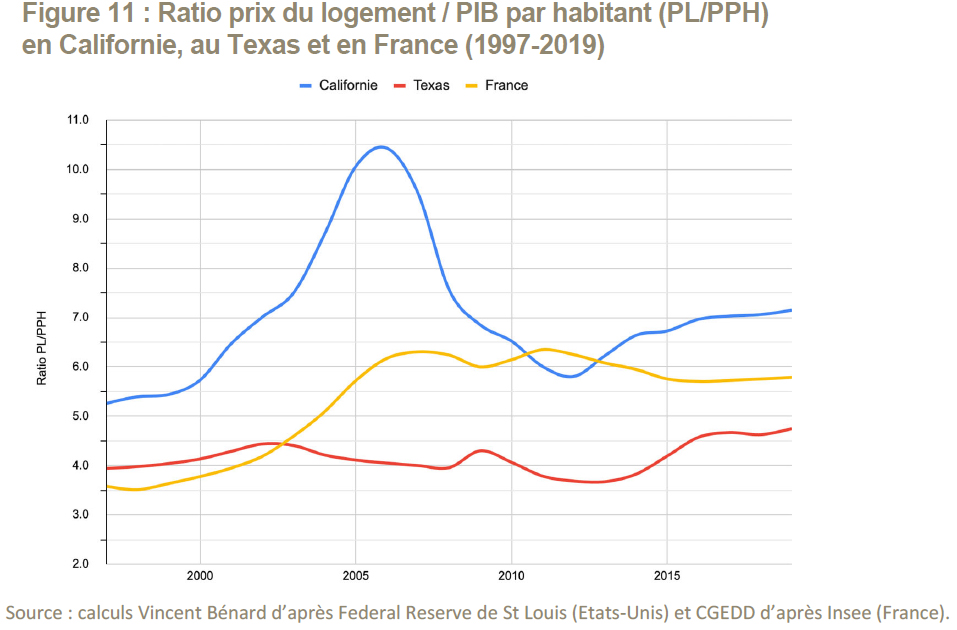
Jusqu’en 2002, les prix français s’alignaient sur les prix texans avec un ratio compris entre 3,5 et 4,5. Depuis, les prix ont presque rattrapé le niveau californien. Ajoutons que les croissances économique et démographique de l’Hexagone ont été bien moins dynamiques qu’au Texas. On peut donc faire l’hypothèse qu’une réglementation des sols réactive aurait sans doute maintenu le niveau des prix français au même niveau, voire en dessous de ceux observés là-bas.
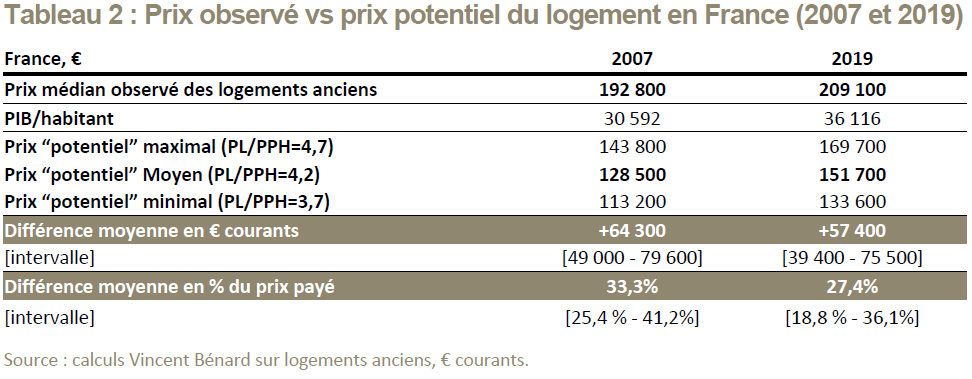
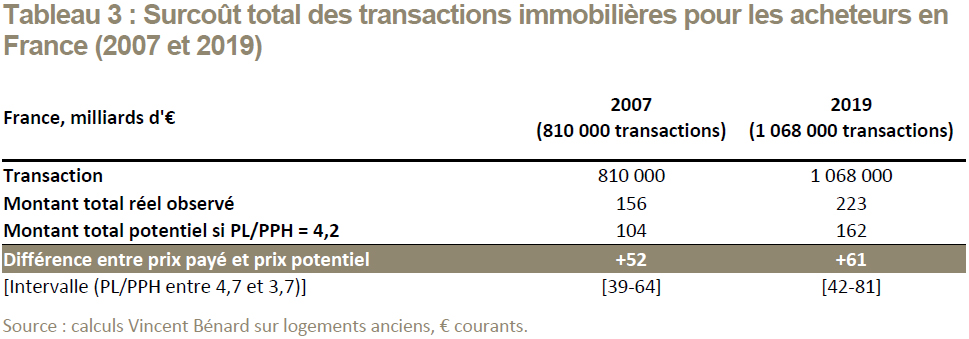
Si le ratio français avait évolué autour de 4,2 (entre 3,7 et 4,7), comme au Texas, plutôt que vers 6, acheter un logement en France pourrait coûter de 20 à 40 % moins cher (Tableau 2).
En rapportant le prix moyen des transactions à leur nombre (810 000 transactions en 2007, 1 068 000 en 2019), la différence de prix payé par les acheteurs serait de 61 milliards d’euros en 2019 (Tableau 3).
Or, statistiquement parlant, le groupe des acheteurs de logements, qui comprend beaucoup de primo-accédants (entre 32 et 55 % suivant les années depuis 2000), est moins riche que celui des vendeurs. Le « prix de la rareté » du logement en France provoque donc un « transfert antisocial » annuel d’environ 61 milliards d‘euros (soit 2,6 % du PIB). Nos lois foncières sont un facteur aggravant des inégalités matérielles et patrimoniales entre ménages. Elles pénalisent les acheteurs mais aussi leurs locataires par ricochet, lorsque les biens ne sont pas destinés à un usage personnel.
Baisser le prix du logement grâce à un nouveau droit foncier réactif, source de bienfaits
Abaisser le coût du logement présenterait bien d’autres avantages. En France, les deux tiers de l’accroissement des populations des aires urbaines économiquement dynamiques ont eu lieu dans les couronnes périurbaines, contre seulement un tiers pour les agglomérations-centre, alors que celles-ci pourvoient 82 % des créations d’emplois sur le territoire.
En cas de baisse du prix du logement dans les grandes agglomérations, certains ménages pourraient choisir de s’en rapprocher, voire d’y habiter. Le géographe Eric Charmes estimait [xxiii] , au milieu de la dernière décennie, à 2 400 euros annuels le surcoût lié aux déplacements pour les ménages périurbains. Outre l’effet délétère sur le pouvoir d’achat des ménages concernés, cela contribue également à augmenter dans d’importantes proportions leurs émissions de gaz à effet de serre.
Les ménages pourraient également consacrer une partie de l’économie faite sur le foncier à bâtir des nouveaux logements énergétiquement beaucoup plus efficaces, pour le plus grand bénéfice, là encore, de l’environnement.
Enfin, un accès facilité au logement réduirait aussi considérablement les besoins d’interventions publiques à finalité sociale dans le logement, lesquelles dépassent 40 milliards d’euros annuels. En l’état actuel des finances publiques, nos gouvernants peuvent-ils faire l’impasse sur de telles sources d’économies ?
Un retour à un droit des sols de type réactif, tel que le connaissent, par exemple, nos voisins allemands, serait de nature à ramener les prix du logement à un niveau raisonnable, et ce de façon durable. En période d’inflation, c’est un levier pour redonner du pouvoir d’achat.
Propositions sur le foncier pour libérer le pouvoir d’achat
Inverser la philosophie des PLU en déclarant tout terrain libre d’affectation (donc constructible) par défaut du moment qu’il est viabilisé, et ne permettre des limitations que sous l’obligation d’indemniser les propriétaires pénalisés par le blocage de la constructibilité. L’indemnisation prendra la forme d’une remise sur la fiscalité locale ou du versement d’un loyer compensant la perte de jouissance partielle du droit de propriété. Cette obligation de compensation financière créera une incitation à réduire les territoires protégés au strict nécessaire.
Prévoir que les coûts de viabilisation des terrains ne pourront pas être supportés par la collectivité, ce qui incitera à privilégier la construction par contiguïté avec les quartiers existants.
Assouplir les règles de construction dans les quartiers sans caractère historique, et notamment lever les freins à la construction en hauteur dans les quartiers des grandes métropoles où existe un marché pour ce type de logements.
Tout propriétaire estimant que le zonage de son terrain lui impose des restrictions non justifiées pourra exercer un droit de pétition argumenté demandant un nouveau zonage. La municipalité devra répondre dans un délai de 3 à 6 mois, selon la taille du terrain et la nature du projet du pétitionnaire. L’absence de réponse vaudra acceptation des autorités locales. Ce nouveau droit permettra de libérer le foncier sans attendre un processus de révision du PLU, par construction très lent.
Les autres chapitres : Introduction
Notes
[i] Insee, série 2.201 Consommation finale effective des ménages par fonction à prix courants, calculs sur la dépense de consommation finale des ménages, excluant les dépenses de consommation individuelles des administrations ou des institutions sans but lucratif au services des ménages.
[ii] Fondation Abbé Pierre. (2018). 12e rapport sur l’État du mal-logement en France 2007 . Paris. Repéré à https://www.fondation-abbe-pierre.fr/nos-publications/etat-du-mal-logement/les-rapports-annuels/12e-rapport-sur-letat-du-mal-logement-en-france-2007 et Fondation Abbé Pierre. (2022). 27e rapport sur l’état du mal-logement en France 2022 | Fondation Abbé Pierre . Paris. Repéré à https://www.fondation-abbe-pierre.fr/sites/default/files/reml2022_web.pdf
[iii] Trannoy, A. et Wasmer, E. (2013). Comment modérer les prix de l’immobilier ? ( [Note du conseil d’analyse économique]) (p. 12). Paris : Conseil d’analyse économique. Repéré à https://www.cae-eco.fr/Comment-moderer-les-prix-de-l-immobilier
[iv] Par rapport à la moyenne de l’UE, le surcout associé au logement en France est de 2,6 % du revenu des ménages et 9 % des dépense de logement (yc eau, chauffage) en 2021. Il représente 33 milliards d’euros au niveau national ou 1 100 euros par ménage. Calculs Institut économique Molinari à partir d’Eurostat, Dépense de consommation des ménages par fonction de consommation [TEC00134__custom_3905594], poste Logement, eau, électricité, gaz et autres combustibles et de l’Insee, Moyenne annuelle en milliers de ménages (30,685 millions) et Consommation des ménages par fonction.
[vii] Inspection Générale de l’environnement et du développement durable, prix immobiliers, évolutions à long terme, Jacques Friggit https://www.igedd.developpement-durable.gouv.fr/prix-immobilier-evolution-a-long-terme-a1048.html . Données source: https://www.data.gouv.fr/fr/datasets/r/fc49934a-9d09-4f0b-b26c-a04054468004
[viii] Afin de faciliter les comparaisons ultérieures inter-États et interpays, nous avons défini un indice d’évolution du prix du logement corrigé de la richesse (PIB) produite par chaque habitant du territoire considéré, appelé PL/PPH par la suite.
[ix] Joseph Comby, “le logement malade du foncier”, Fonciers en débat, 2015 https://fonciers-en-debat.com/le-logement-malade-du-foncier/
[x] Cette hausse ne concernait que le foncier résidentiel et non le foncier agricole, dont la valeur totale a diminué.
[xi] Cavailhès, J. (2022, 28 mai). La valeur des terrains et des actifs immobiliers dans le patrimoine des ménages. Fonciers en débat . Repéré à https://fonciers-en-debat.com/la-valeur-des-terrains-et-des-actifs-immobiliers-dans-le-patrimoine-des-menages/
[xii] Chaque type de droit des sols touche à peu près 50 % de la population américaine.
[xiii] Les termes “réactif” et “restrictif” sont la traduction imparfaite de l’auteur des termes “responsive” et “prescriptive” utilisés outre atlantique. Les partisans du droit des sols restrictifs l’implémentent fréquemment sous le vocable de “smart growth”.
[xiv] La collectivité peut limiter ces droits pour des raisons d’harmonie collective, cette limitation ne peut avoir lieu que sous forte contrainte démocratique et sous réserve de juste compensation de la perte de jouissance de la propriété induite.
[xv] Glaeser, E. L. et Gyourko, J. (2002, mars). The Impact of Zoning on Housing Affordability [Working Paper]. National Bureau of Economic Research. doi: 10.3386/w8835
[xvi] Demographia. (2020). 16th Annual Demographia International Housing Affordability. Survey: 2020. Rating Middle-Income Housing Affordability (p. 64). Performance urban planing. Repéré à http://www.demographia.com/dhi2020.pdf
[xvii] Sachant que les logements construits dans les métropoles texanes sont plus grands qu’en Californie.
[xviii] Zhou, L., Shen, G., Wu, Y., Brown, R., Chen, T. et Wang, C. (2018). Urban Form, Growth, and Accessibility in Space and Time: Anatomy of Land Use at the Parcel-Level in a Small to Medium-Sized American City. Sustainability , 10 (12), 4572. doi: 10.3390/su10124572
[xix] Cox, W. (2008). How Smart Growth Exacerbated the International Financial Crisis . Washington : Fondation Heritage. Repéré à https://www.heritage.org/international-economies/report/how-smart-growth-exacerbated-the-international-financial-crisis
[xx] Krugman, P. (2005, 8 août). That Hissing Sound. The New York Times . Repéré à https://www.nytimes.com/2005/08/08/opinion/that-hissing-sound.html
[xxi] Hsieh, C.-T. et Moretti, E. (2015, 1 mai). Why Do Cities Matter? Local Growth and Aggregate Growth [SSRN Scholarly Paper]. Rochester, NY. doi: 10.2139/ssrn.2693282
[xxii] Hsieh, C.-T. et Moretti, E. (2019). Housing Constraints and Spatial Misallocation. American Economic Journal: Macroeconomics , 11 (2), 1‑39. doi: 10.1257/mac.20170388
[xxiii] Charmes, E. (2013). L’artificialisation est-elle vraiment un problème quantitatif ? Etudes foncières , (162), 23.
L’article Le coût excessif du logement nuit au pouvoir d’achat est apparu en premier sur Institut économique Molinari .
The findings: French pensions, which depend almost exclusively on a pay-as-you-go system in the private sector and unfunded in the public sector, are less attractive because of the declining birth rate, which reduces the resources available to finance benefits.
The challenges: Diversify the method of financing, to improve contributions and pensions in setting up collective capitalization for all private sector employees, on the model of the ERAFP for civil servants.
For a structural reason independent of the return of inflation, purchasing power in France has been undermined for decades. The almost exclusive use of a pay-as-you-go system to fund pensions has been increasing labour costs and squeezing take-home wages since the baby boom counter-shock.
The fall in birth rate makes the pay-as-you-go system less attractive
Beyond the arrangements put in place to preserve purchasing power, with mechanisms to reduce charges on low wages, bonuses or tax-free overtime, the heart of the problem is the particularly expensive method of financing French pensions.
Purchasing power, which stems from the ability to create wealth, has been at the heart of concerns for years. France experienced weaker economic growth than the rest of the European countries in the 2010s, which weighed on wage growth. This phenomenon is, in part, linked to a French particularity: the weight of social contributions. They exceed salaries net of taxes according to our latest annual barometer (102%). This is unique in the European Union, where social security contributions represent on average 52% of wages net of tax. [i]
Contrary to popular belief, this differential is not explained by the generosity of our Social Security, all our major European neighbours have social protections that are at least as comprehensive. The provision of social protection in France is not more qualitative. More specifically, the weight of social protection expenditure in French GDP (34%) is close to Germany (30%) or Italy and the Netherlands (29%). Per capita social protection expenditure in France (€12,200) is equivalent to that of Germany (€12,600) and lower than in the Netherlands (€13,500), and OECD projections show that future replacement rates will be average, despite the size of pension contributions which represent 28% of gross wages (Figure 23).
Source: Institut économique Molinari based on OECD with compulsory public and private schemes and future net replacement rates calculated as a percentage of net life wages [ii] .
Private pensions, which are almost exclusively pay-as-you-go, absorb 28% of gross salaries
The additional French cost in terms of social security contributions is above all the consequence of the almost exclusive financing of pensions by pay-as-you-go. This state of affairs is the consequence of a long process of placing under supervision and then extinguishing the collective capitalizations which had appeared. Initiated in 1854 in the public sector, with the dismantling of the departmental retention funds, this process reached its peak with the extinction of collective capitalizations at the end of the Second World War [iii] . Since then, the situation has never been corrected in France. Despite their advantages, individual or group retirement savings plans (PER) represent only a marginal share. In 2019, funded arrangements accounted for 4.2% of contributions and 2.1% of benefits in France [iv] .
However, the distribution shifts the purchasing power of the active to the retired without creating any. It is problematic for the purchasing power of the active in an ageing society. When it was introduced in 1941 and generalized at the Liberation in the private sector, the situation was favourable. There were 4 contributors to the Cnav to finance a pensioner with a small pension in 1956 [v] , at a time when retirement mobilized only 5% of GDP.
Today, the situation is radically different. There are almost 3 times fewer contributors to finance a pensioner (1.4 contributors for a pensioner to the Cnav) with a significant pension, for an incidentally longer period [vi] , in a country where pensions paid by the pay-as-you-go or the budget absorb about 14% of GDP.
As a result, social security contributions have exploded, increasing labour costs, and squeezing net wages. This scissors effect generates a double penalty with a lack of competitiveness and a purchasing power of employees reduced by pension contributions representing 28% of gross salaries in the private sector. The situation in the public sector is even worse because of the demographic imbalances in the state civil service. The latter does not have a pension plan in the private sector sense. It is destabilizing public finances, which have been systematically in deficit since the shock of the baby boom [vii] .
In comparison with a mixed system, a shortfall of 1700 euros for an average employee
While theoretically the « implicit » return on allocation may equal that on funding in some circumstances [viii] , the reality has been different since the baby boom shock. A very large number of studies point out that the profitability of financial investments is now greater than the development of the economy, thus indicating that the choice of full distribution practiced in France causes losses for employees (Zoom 4).
Capitalization, especially when it is collective, is an economic way of financing pensions. It makes it possible to rely on the performance of the financial markets, which improve the contributions resulting from compulsory levies. From an individual point of view, with the same amount of compulsory contributions, capitalization generates better pensions than pay-as-you-go. A part of the pensions is financed by gains related to investments (dividends, capital gains, etc.), which makes it possible to reduce pension contributions and/or increase net wages for the same pension. From a macroeconomic point of view, capitalization makes it possible to save compulsory levies, by improving the quality/price ratio of public services, but also to allocate more capital to the financing of the economy. [ix]
Therefore, Dutch employees with significant pension funds will have more generous future pensions than in France (Figure 23). With 25% of contributions, 3 points less than in France (28%), the Dutch should have a replacement rate of 89% of net salary, 15 points more than in France (74%).
Also, there is a relative consensus among economists that the long-term return on funding is two to three times higher than the « implicit » return on distribution since the baby boom countershock. Under these conditions, half or even two-thirds of the contributions paid on a pay-as-you-go basis constitute an “implicit tax”. As Davanne and Pujol point out, by investing in the markets, one could obtain the same pension with half the effort rate [x] .
It should be noted that the economists’ standard recommendation is to operate in a mixed system, combining distribution and capitalization. The combination of allocation and funding makes sense, even when the return on allocation is low (Zoom 5).
As Philippe Trainar explains, when it comes to pensions, we need to diversify funding sources [xi] . According to him, « if we take into account the higher volatility of capital income compared to labour income, especially wages, the optimal distribution would be around 33% and 66% respectively for capitalization and distribution in France » [xii] .
We have adopted this recommendation and quantified the cost of the lack of pension diversification. To do this, we used the rates of return anticipated by Thomas Piketty in his book Capital in the XX century , i.e. 1.5% for the economy – representative of the distribution – and 4.25% for capitalization [xiii] .
For an employee whose salary grows with the growth rate of the economy, a mixed system with 2/3 distribution and 1/3 capitalization would allow, for equal contributions, to distribute 29% more pension. The capitalization component would boost the performance of the ensemble. It would finance 48% of the retirement pension whereas it would represent 1/3 of the payments, amounts comparable to that of the supplementary scheme for pharmacists (CAVP) operating both on a pay-as-you-go and funded basisFigure 25: Cost-effectiveness of a mixed system compared to 100% pays-as-you-go and capitalisation systems
Figure 25) [xiv] . These ratios are comparable to those of the complementary pension plan for pharmacists (CAVP), which operates on both a pay-as-you-go and a funded basis [xv] .
Alternatively, a mixed scheme funded by contributions representing 22% of gross salary could distribute the same pensions as the current distribution requiring contributions representing 28% of gross salary. The current situation represents an implicit tax of around 6% of gross salaries, i.e. a shortfall of 1,700 euros net of social contributions [xvi] .
Generalizing collective capitalization, a challenge for purchasing power and equity
To remedy the loss of purchasing power generated by the under-development of retirement savings, the most egalitarian solution is to generalize collective capitalization to all employees, on the model of what has been done for civil servants with The Establishment for Additional Retirement of the Public Service (ERAFP).
The standard advice is to organize pensions with 3 pillars, one of which is pay-as-you-go, one is mandatory collective funding, and one is optional [xvii] . Voluntary allocation and capitalization are extensive in France, but collective capitalization is not widespread. However, it brilliantly finances most of the pensions in some public institutions (Bank of France, Senate…). It has also been successfully reintroduced according to a complementary logic in the public service (ERAFP), pharmacists (CAVP) or well performing and responsible companies (collective or mandatory PER). Unfortunately, most employees do not have access to it. In France, capitalization remains « disorganized » [xviii] with a minority of workers having access to more efficient pension schemes, which generates inequalities and misalignments of interests within the private sector or between employees and civil servants [xix] .
Some argue that it is impossible or too late to ramp up collective capitalizations in France. However, the examples of civil servants (ERAFP) and pharmacists (CAVP) show that it is possible to increase collective capitalization, without further destabilizing the distribution handicapped by unfavourable demographics [xx] .
Pension proposals for purchasing power
Each private sector employee will have a personal account, funded monthly by employer (1% of gross salary) and employee (1% of gross salary) contributions.
These sums will be paid to an additional retirement establishment for private sector employees (ERASP). Copied on the model of The Establishment for Additional Retirement of the Public Service (ERAFP), it will be hosted by Agirc-Arrco, which will allow it to benefit from the advantages of parity governance within a pension fund with strong legitimacy.
This reform will be carried out according to a principle of « neutrality for the pay slip ». The creation of ERASP will be done concomitantly with the reduction of taxes on the pay slip that do not create rights (CSG-CRDS, etc.) to avoid any deterioration in competitiveness or purchasing power.
Start provisioning the pensions of new civil servants within the FRR, in order to save public money as the Bank of France or the Senate do.
Reform the CNAV so that it has reserves to cushion shocks, as it exists in all well-managed pay-as-you-go schemes in France or abroad (Sweden).
Put an end to the process of placing under supervision well-managed private funds (Agirc-Arrco…) that have no reason to have their contributions managed or their reserves divested.
Abolish the social lump sum on all payments made by companies in PACTE products, to increase the amounts credited to savers’ accounts.
Neutralize the calculation of capital gains on all retirement or long-term savings products, to avoid calculating (fictitious) capital gains on inflation.
Improve the taxation of capital outflows, by reversing all the deterioration made as part of the harmonization process between products existing before the PACTE law.
Zoom 4: A consensus that the distribution is less efficient
Georges Gallais-Hamonno and Pedro Arbulu showed in 1995 that capitalization was attractive in the second half of the 20th century in France [xxi] . The results are similar in Germany [xxii] and in all OECD countries. [xxiii]
Closer to home, Bouhakkou, Coën and Folus attest to a 5-point differential between equity market returns and the distribution between 1977 and 2016, with a ratio of 3 to 1. The French Autorité des marchés financiers also points out that equity market returns are significant. According to it, they exceed by 2 to 3 times the average growth in the major developed countries [xxiv] . Similarly, in a 2020 note, Natixis’ economic research team showed that the average return on the allocation was around 1.8% per year from 1982 to 2019 compared to 8.8% net of inflation for a capitalization invested equally between equities and bonds [xxv] .
The benefit of allocation vis-à-vis capitalization could last. In 1997, Olivier Davanne and Thierry Pujol expected long-term growth of around 2%, compared to 4 to 6% for a « reasonable » estimate of the long-term return on diversified capital. [xxvi] They pointed to the implicit taxation represented by the almost exclusive use of distribution in France. Their point of view was shared by Jean-Hervé Lorenzi, according to whom « to have the same level of benefits at a given time, funded retirement is less expensive, all other things being equal, since it is more profitable and therefore requires a lower level of initial ‘committment' » [xxvii] . We find the same perception in Didier Blanchet, according to which the data lean « in favour of capitalization if the return on capital is higher than the growth rate (r > g) ». [xxviii]
More recently, in a best-selling 2013 book, Thomas Piketty provides forward-looking elements along the same lines. According to him, the rate of return on capital (r) would be historically stable and higher than growth (g). For the economist, « everything suggests that the average rate of return on capital will be well above the rate of economic growth during the twenty-first century (about 4%-4.5% for the first, barely 1.5% for the second) ». [xxix]
Zoom 5: A consensus on diversifying pension funding to reduce risks
The idea that a combination of pay-as-you-go and capitalization systems can be optimal due to diversification was initiated by Robert Merton in 1983. An advocate of the pay-as-you-go system, he explains that it would be a mistake to do without it, even when it has a low « implicit » return. It helps to cover other risks that individuals may face during their lives. It allows one generation to benefit from the human capital of the next generation. [xxx]
Merton’s approach has resulted in a significant production of articles over thirty years. His model, based on portfolio theory, explains why diversification between allocation and capitalization is optimal. It was enriched with Zvi Bodie and Paul Samuelson in 1992 [xxxi] , then extended to inflationary risk with Willem Heeringa in 2008. [xxxii] The consensus, summarized by Pierre Devolder and Roberta Melis, is that « funded and pay-as-you-go pension plans may look very different but are in fact complementary because they deal with different risks. » [xxxiii]
We find the same approach in Didier Folus, who considers that « the risk factors that affect the performance of a pay-as-you-go plan or a funded plan, do not act a priori simultaneously on both mechanisms » [xxxiv] . In a recent study with Léa Bouhakkou and Alain Coën, he concludes that « in most cases, a mixture of the two systems is desirable » [xxxv] .
Notes
[i] Marques, N., Philippe, C. and Rogers, J. (2022). The real social and fiscal burden of the average employee in the EU in 2022 (p. 44). Paris-Brussels: Institut économique Molinari. Retrieved from https://www.institutmolinari.org/wp-content/uploads/2022/07/etude-fardeau-fiscal-eu-2022.pdf
[ii] OCDE. (2021). Panorama des pensions 2021 de l’OCDE, comment la France se situe-t-elle ? Retrieved from https://www.oecd.org/fr/france/PAG2021-FRA.pdf
[iii] See, for example, Trademarks, N. (2022). Pensions, the challenge is to generalize collective capitalization in France -. Journal of Liberties , (17). Retrieved from https://journaldeslibertes.fr/article/retraites-lenjeu-est-de-generaliser-la-capitalisation-collective-en-france/
[iv] Directorate of Research, Studies, Evaluation and Statistics. (2022). Retirees and pensions – 2021 edition . Paris. Retrieved from https://drees.solidarites-sante.gouv.fr/publications-documents-de-reference/panoramas-de-la-drees/les-retraites-et-les-retraites-edition-0
[v] https://www.statistiques-recherches.cnav.fr/recueil-statistique-2019.html , Title 2.
[vi] Contrary to popular belief, most of the pension imbalances are linked to the decline in the ratio of contributors per retiree (-66 % since 1956), the increase in life expectancy (+20 % at birth since 1956) playing a lesser role. For the dynamics of life expectancy at retirement see for example Aubert, P. and Rabaté, S. (2015). Length spent in career and length of life in retirement: what is the sharing of gains in life expectancy? (n o 474). Paris: INSEE. Retrieved from https://www.insee.fr/fr/statistiques/1377630?sommaire=1377636
[vii] State officials have never integrated the distribution, hence the unsuccessful attempt to create a « universal regime » in 2020. Their pensions are budgeted under an unfunded defined benefit pension scheme. That choice, dating from 1854, was never called into question, even at the Liberation, since civil servants had not joined the general social security scheme. Cnav). With the decline in the birth rate, accentuated by the effects of decentralization, it has become particularly expensive. In 2020, the ratio of contributors per retiree in the state civil service is 0.86 (vs. 1.4 at the CNAV). As a result, the pension contributions of civil servants represent 85 % of gross index-linked salaries, i.e. 3 times more than what is observed for employees with a less degraded demographic. The balancing subsidies needed to balance civil servants’ pensions amount to around €33 billion per year. For more information Marques, N. (2022). Pensions, miscalculations and public deficits. When an official barometer undervalued has been undermining public debate for 20 years (p. 46). Paris-Brussels: Institut économique Molinari. Retrieved from https://www.institutmolinari.org/wp-content/uploads/2022/09/etude_retraites_mecomptes_deficits_publics.pdf
[viii] Paul Samuelson, winner of the 1970 Nobel Prize in Economics, developed a theory of the equivalence between distribution and capitalization. In a 1958 article, the American economist considered the case of an economy where there would be no possibility of accumulating capital, which somehow melted like snow in the sun. Under these conditions, pensions would be financed exclusively on a pay-as-you-go basis. The working population would transfer part of their income to retirees, while hoping that future generations would show the same care, helping them to support themselves once retirement time comes. There would be no investment, therefore no return. However, despite this observation, Samuelson considers that pay-as-you-go pensions provide a return, which he describes as « implicit ». More interestingly, this return could be equal to that of capitalization. Samuelson rightly points out that pay-as-you-go pensions can be distributed all the more generous the higher the rate of population growth. Indeed, at unchanged contribution rates, the revenues of a pay-as-you-go plan will be all the greater the more assets there are. Everything happens, in fact, as if the distribution yielded a « biological interest rate » equivalent to the rate of population growth. If we have a dynamic demographic, like that of the baby-boom years, this « rate » of interest is more significant than if, on the contrary, the population is stationary or aging. Another interesting result is that the economist shows that the implicit return of the allocation can, under certain conditions, be equal to that of capitalization. If the population growth rate is equivalent to the return on financial markets, there is equivalence between pay-as-you-go (implicit) and capitalization (explicit) returns. Samuelson, P. (1958). « An Exact Consumption-loan Model of Interest with or without the Social Contrivance of Money » Journal of Political Economy , volume LXVI December n°6 pp. 467-482.
[ix] Institut économique Molinari and CroissancePlus. (2021). For a pension reform that responds to French challenges – Competitiveness, employment, innovation with capitalization for all (p. 88). Paris. Retrieved from https://www.institutmolinari.org/wp-content/uploads/2021/09/etude-retraites-croissanceplus-molinari.pdf
[x] Davanne, O. and Pujol, T. (1997). Economic analysis of pay-as-you-go retirement. French Journal of Economics , 12 (1), 33‑56. two: 10.3406/rfeco.1997.1014 , p41
[xi] Trainar , P. (2017). Is the creation of pension funds still useful in advanced economies?, Journal of Financial Economics , NO. 126 2017/2 , pp. 123-142.
[xii] Trainar , P. (2017). Is the creation of pension funds still useful in advanced economies?, Journal of Financial Economics , NO. 126 2017/2 , page 136.
[xiii] « The lowering of the growth rate to around 1.5 % per year in rich countries – and perhaps eventually in the whole world – reduces the return on distribution by the same amount. Everything suggests that the average rate of return on capital will be over the twenty-first period. Th century well above the rate of economic growth (about 4%-4,5% for the first, just 1.5 % for the second). Piketty, T. (2013). Capital in the XXI Th century , Threshold, Chapter 13, pp. 751 ff.
[xiv] Prospective calculations made by the Institut économique Molinari for a pure pay-as-you-go scheme (as for private sector employees), a pure collective capitalization scheme (as for Banque de France employees) or a mixed scheme (as for pharmacists with the CAVP).
The hypothesis of return is borrowed from Piketty, with a 1.5% growth rate for the economy and a 4.25% rate of return on capital cf. Piketty, T. (2013). Le capital au XXIème siècle, Seuil, chapter 13, pages 751 and following. The distribution replacement rate (74% of average net earnings calculated over a lifetime) for 28% of gross contributions is borrowed from the OECD. (2021). OECD Pension Outlook 2021, where does France stand? Retrieved from https://www.oecd.org/fr/france/PAG2021-FRA.pdf
The progression of wages and contributions is in line with the growth of the economy over the entire contribution period (42 years). For 1 euro contributed in the first year, the employee contributes 1.84 euros in the 42nd year, his or her salary increasing by 84% net of inflation over the period.
The wealth created in the 42nd year represents 78 euros in a pay-as-you-go system (according to an « implicit » return logic), 147 euros in a pure capitalization system (87% more) and 101 euros with a mixed system (29% more).
30 See for example Holzmann, R. (2013). Global pension systems and their reform: Worldwide drivers, trends and challenges. International Social Security Review, 66(2), 1 29. doi:10.1111/issr.12007
31 Expression borrowed from Patrick Artus and Florence Legros. Artus, P. and Legros, F. (1999). The choice of the pension system, Economica, page 145. According to them, a dose of “general capitalization” is doubly advantageous. It would prevent conflicts between employees, by democratizing effective financial products beyond those that are informed or come from large companies.
32 Civil servants benefit from defined-benefit pensions. Their pension is linked to their last index salary and is protected from demographic trends and economic hazards. On the other hand, a significant part of the pensions of private sector employees is defined contribution, with well-managed schemes redistributing what they collect (or what they have put in reserve to smooth out one-off shocks). In a context of falling birth rates, private sector employees are mechanically subject to a drop in the replacement rate. On the contrary, public personnel are protected, the imbalances in the pensions of civil servants materializing through the increase in public expenditure and deficits.
33 See for example Molinari Economic Institute and CroissancePlus. (2021). For a pension reform that meets French challenges – Competitiveness, employment, innovation with capitalization for all (p. 88). Paris. Retrieved from https://www.institutmolinari.org/wp-content/uploads/2021/09/etude-retraites-croissanceplus-molinari.pdf
[xv] The supplementary pension for pharmacists operates in a mixed manner, with a Pay-as-you-Go (PAYG) and a Capitalized Supplementary Plan (CSG). Pay-as-you-go (PAYG) attracts 61% of contributions and distributes 48% of benefits. The Capital Accumulation Plan (CAP) attracts 39% of contributions and distributes 52% of benefits. The return on investment for capitalization is better, as the RCC benefits from the return on invested capital, while distribution (RCR) is penalized by the unfavorable demographics of pharmacists, with 0.9 contributors per beneficiary. CAVP. (2022). Key figures, July 2022 edition (p. 16). Paris: Caisse d’assurance vieillesse des pharmaciens. Retrieved from https://www.cavp.fr/media/documents/Publications/2022/CAVP-2022-CHIFFRES-CLES.pdf
[xvi] Calculation by Institut économique Molinari for an average employee with a gross salary of 38,200 euros per year. His pension contributions represent 28% of gross salary, or 10,700 euros per year when employer and employee contributions are added together. In a mixed system, a contribution of 22% of gross salary would be sufficient (8,300 euros), which means a saving of 2,400 euros gross per year. After deducting employee contributions (24%) and income tax (6% for an average single employee), the savings under the mixed system are 1,700 euros net per year.
[xvii] Holzmann, R. (2013). Global pension systems and their reform: Worldwide drivers, trends and challenges. International Social Security Review , 66 (2), 1‑29. doi: 10.1111/issr.12007
[xviii] Expression used by Patrick Artus and Florence Legros. Artus, P. and Legros, F. (1999). Le choix du système de retraites, Economica, page 145. According to them, a dose of « general capitalization » would prevent conflicts between employees and generations, by democratizing efficient financial products beyond those that are informed or under the control of large companies.
[xix] Civil servants benefit from defined-benefit pensions. Their pension is linked to their last index salary and is protected from demographic trends and economic hazards. On the other hand, a significant part of the pensions of private sector employees is defined contribution, with well-managed schemes redistributing what they collect (or what they have put in reserve to smooth out one-off shocks). In a context of falling birth rates, private sector employees are mechanically subject to a drop in the replacement rate. On the contrary, public personnel are protected, the imbalances in the pensions of civil servants materializing through the increase in public expenditure and deficits.
[xx] See for example Institut économique Molinari et CroissancePlus. (2021). Pour une réforme des retraites qui réponde aux enjeux français – Compétitivité, emploi, innovation avec la capitalisation pour tous (p. 88). Paris. https://www.institutmolinari.org/wp-content/uploads/2021/09/etude-retraites-croissanceplus-molinari.pdf
[xxi] Their work shows that the real return on an equity investment over the very long period (6.9% per year in France between 1950 and 1992) was significantly higher than the growth rate of the economy (3.6% over the same period). Gallais-Hamonno, G. and Arbulu, P. (1995). “The real profitability of stock market assets”, Economie & Statistique , n°281 pp. 3-30.
[xxii] Siebert, H. (1997). « Pay-as-you-go versus capital funded pension systems: the issues », Kiel Working Papers 816, Kiel Institute for the World Economy (IfW).
[xxiii] With a differential of 4 to 5 points between stock market returns and real income growth between 1967 and 1990 and a ratio of 3 to 1. Davis, E.P. (1995 ). Pension Funds: Retirement-Income Security and Capital Markets, an International Perspective, Clarendon Press, Oxford cited by Blanchet, D. (1998). « The distribution-funding debate: an inventory », in Conseil d’Analyse Economique (1998), « Retraites et épargne », Documentation française, p. 98.
[xxiv] Authors’ calculations based on Autorité des marchés financiers (2013), “Letter of Economics and Finance”, 2013-3, pages 12-20 based on Thomson Reuters; Growth rates calculated by the author from OECD series (constant prices series, constant PPPs).
[xxv] Natixis. (2020). France: What would be the situation of retirees if they had had pension funds since the beginning of the 1980s? ([Flash Saver] No. 1) (p. 5). Paris.
[xxvi] Davanne, O. and Pujol, T. (1997). “Economic analysis of pay-as-you-go retirement”, Revue française d’économie, volume XII winter, pages 40-41.
[xxvii] Lorenzi, J.H. (1998). “Consolidating retirement while respecting a new balance: economic efficiency return-risk pooling-social equity”, page 42 in Davanne, O., Lorenzi, J.H. and Morin, F. (1998). “Retirement and savings”, Economic Analysis Council, July.
[xxviii] Blanchet, D. (1998). “The distribution-capitalization debate: an inventory”, page 93 in Davanne, O. Lorenzi, J.H. and Morin, F. (1998). “Retirement and savings”, Economic Analysis Council, July 2017.
[xxix] “The lowering of the growth rate to around 1.5% per year in the rich countries – and perhaps in the long term in the whole of the planet – reduces the return on distribution by the same amount. Everything leads one to think that the average rate of return on capital will be during the 21st century clearly above the rate of economic growth (about 4%-4.5% for the first, barely 1.5% for the second). Piketty, T. (2013). Capital in the 21st century, Seuil, chapter 13, pages 751 et seq.
[xxx] Merton, R.C. (1983). “On the Role of Social Security as a Means for Efficient Risk Sharing in an Economy Where Human Capital Is Not Tradable. In Financial Aspects of the United States Pension System, edited by Z. Bodie and J. Shoven, pp. 325–358. Chicago: Chicago University Press.
[xxxi] Bodie, Z. Merton, R.C. and Samuelson, W.F. (1992). “Labor Supply Flexibility and Portfolio Choice in a Lifecycle Model”, Journal of Economic Dynamics and Control, vol. 16, no. 3, p. 427-449.
[xxxii] Heeringa, W. (2008). “Optimal Lifecycle Investment with Pay-As-You-Go Pension Schemes: A Portfolio Approach”, Working Paper No. 168, De Nederlandsche Bank, Amsterdam.
[xxxiii] Devolder, P. and Melis, R. (2015). “Optimal mix between pay as you go and funding for pension liabilities in a stochastic framework”, Astin Bulletin, The Journal of the IAA, Volume 45, Number 3, September 2015, pp. 551-575, doi.org/10.1017/asb.2015.14.
[xxxiv] Folus, D. (2015), Towards mandatory retirement savings in France? Transition challenges, note from the Demographic Transitions, Economic Transitions Chair (TDTE), Caisse des dépôts, January, page 7.
[xxxv] Bouhakkou, L., Coën, A. and Folus, D. (2019). A portfolio approach to the optimal mix of funded and unfunded pensions, Applied Economics, page 1 DOI:10.1080/00036846.2019.1678728.
L’article In search of lost purchasing power – Chapter 4: Lack of pension diversification hurts purchasing power est apparu en premier sur Institut économique Molinari .
L’article Retraites : François Bayrou rédige enfin une note utile est apparu en premier sur Institut économique Molinari .
L’article Comment les impôts et les normes amputent le pouvoir d’achat des Français est apparu en premier sur Institut économique Molinari .
L’Institut économique Molinari publie une étude disséquant des facteurs structurels alimentant les tensions autour du pouvoir d’achat en France. Cette étude analyse quatre familles de réglementations réduisant le pouvoir d’achat des ménages d’au moins 4 300 euros par an. Elle propose des réformes structurelles permettant de répondre aux préoccupations des ménages, en libérant leur pouvoir d’achat en améliorant le rapport qualité/prix de leurs consommations individuelles et collectives.
Lire l’étude • Lire le communiqué • Read the study • Read the press release
En ces temps d’instabilité marqués par la concomitance d’une pandémie mondiale et le retour des guerres aux confins de l’Europe, les inquiétudes sur le pouvoir d’achat sont particulièrement importantes.
Si l’on savait que la croissance des salaires était devenue modeste dans les pays développés, cet effet était encore récemment contrebalancé par l’accès à des produits étrangers relativement bon marché. La pandémie comme le conflit ukrainien continuent de susciter une réorganisation des flux de marchandises, notamment énergétiques et un renchérissement d’un certain nombre de produits. Les préoccupations autour du pouvoir d’achat et de l’inflation sont devenues plus prégnantes. Fidèle à la tradition de l’Institut économique Molinari, nous avons cherché à faire une analyse de fond en intégrant différents facteurs structurels expliquant, en partie au moins, les tensions structurelles autour du pouvoir d’achat.
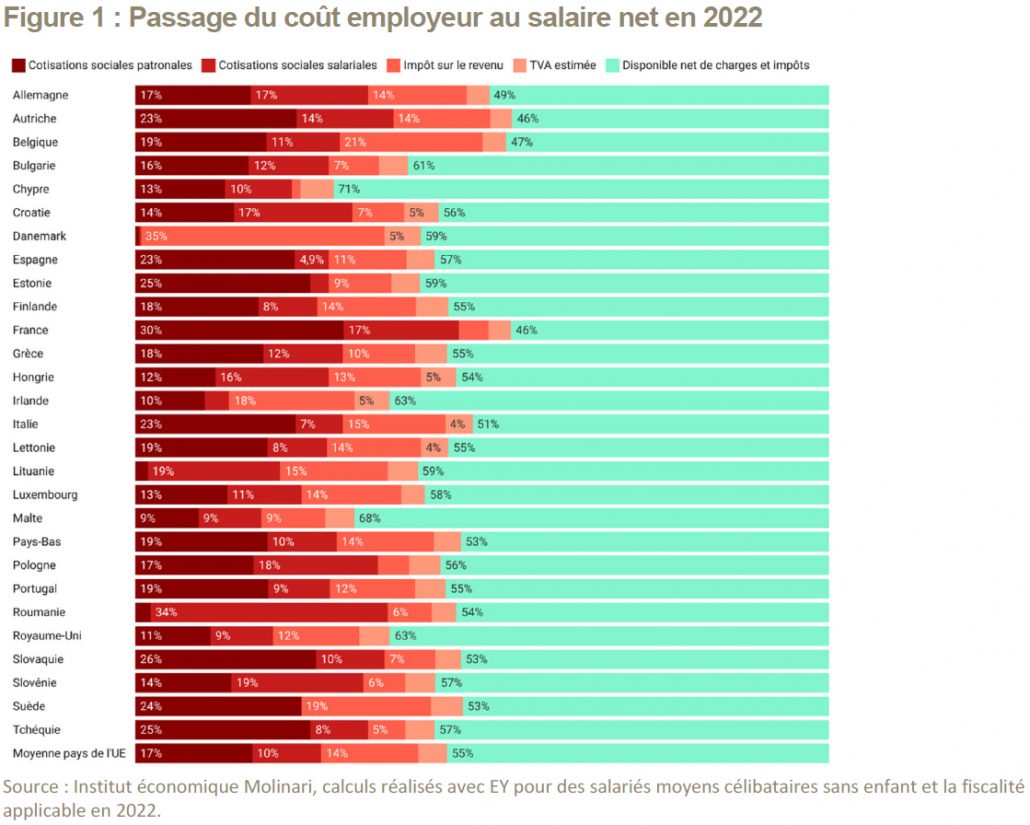
Chaque année, depuis 2010, nous publions un classement européen des pays en fonction de la pression sociale et fiscale réelle qui pèse sur le salarié moyen. Les fiscalités mesurées incluent les cotisations patronales et salariales aux régimes obligatoires de droit public et de droit privé (mutuelles, fonds de pension…), l’impôt sur le revenu et la TVA. En France, la fiscalité sur le salarié moyen ressort à 54 % (Figure 1). Le salarié moyen est particulièrement bien payé avec 54 600 euros avant cotisations et impôts, mais son travail est si fiscalisé qu’il ne lui reste que 25 000 euros nets.
Dans les faits, toutes une série de réglementation augmentent le poids qui pèse sur les salariés au-delà de ce que montre cette analyse tenant compte des cotisations sociales, de l’impôt sur le revenu et de la TVA. Des fiscalités ou réglementations particulières ont une incidence – directe ou indirecte – sur le pouvoir d’achat. Il nous a semblé intéressant d’en mesurer l’ampleur pour mieux comprendre les tensions actuelles.
Des réglementations particulières renchérissent ainsi le prix du logement qui constitue désormais le 1er poste de dépense des ménages (chapitre 1). Des fiscalités particulières renchérissent le prix de certains biens, notamment des carburants et du tabac (chapitre 3). Dans le même temps, une fiscalité particulièrement élevée sur les activités économiques renchérit le coût du travail et nuit à la création de richesse et au dynamisme des salaires (chapitre 3), tandis que l’absence de diversification des retraites renchérit le coût de financement des retraites, ce qui grève le salaire net des actifs comme des retraités (chapitre 4).
Les réformes structurelles proposées dans le cadre de ce travail permettraient de répondre, au moins en partie, aux préoccupations légitimes des Français sur leur pouvoir d’achat en le libérant sans pour autant nuire à la collectivité dans son ensemble.
etude-pouvoir-achat-perdu-frL’article A la recherche du pouvoir d’achat perdu – Quand des politiques publiques nuisent au pouvoir d’achat est apparu en premier sur Institut économique Molinari .
- cloud_queue