• chevron_right

      This tool lets you see how much time and money is wasted commuting

      news.movim.eu / ArsTechnica · Thursday, 23 February, 2023 - 16:21 · 1 minute

    Traffic Along Park Avenue

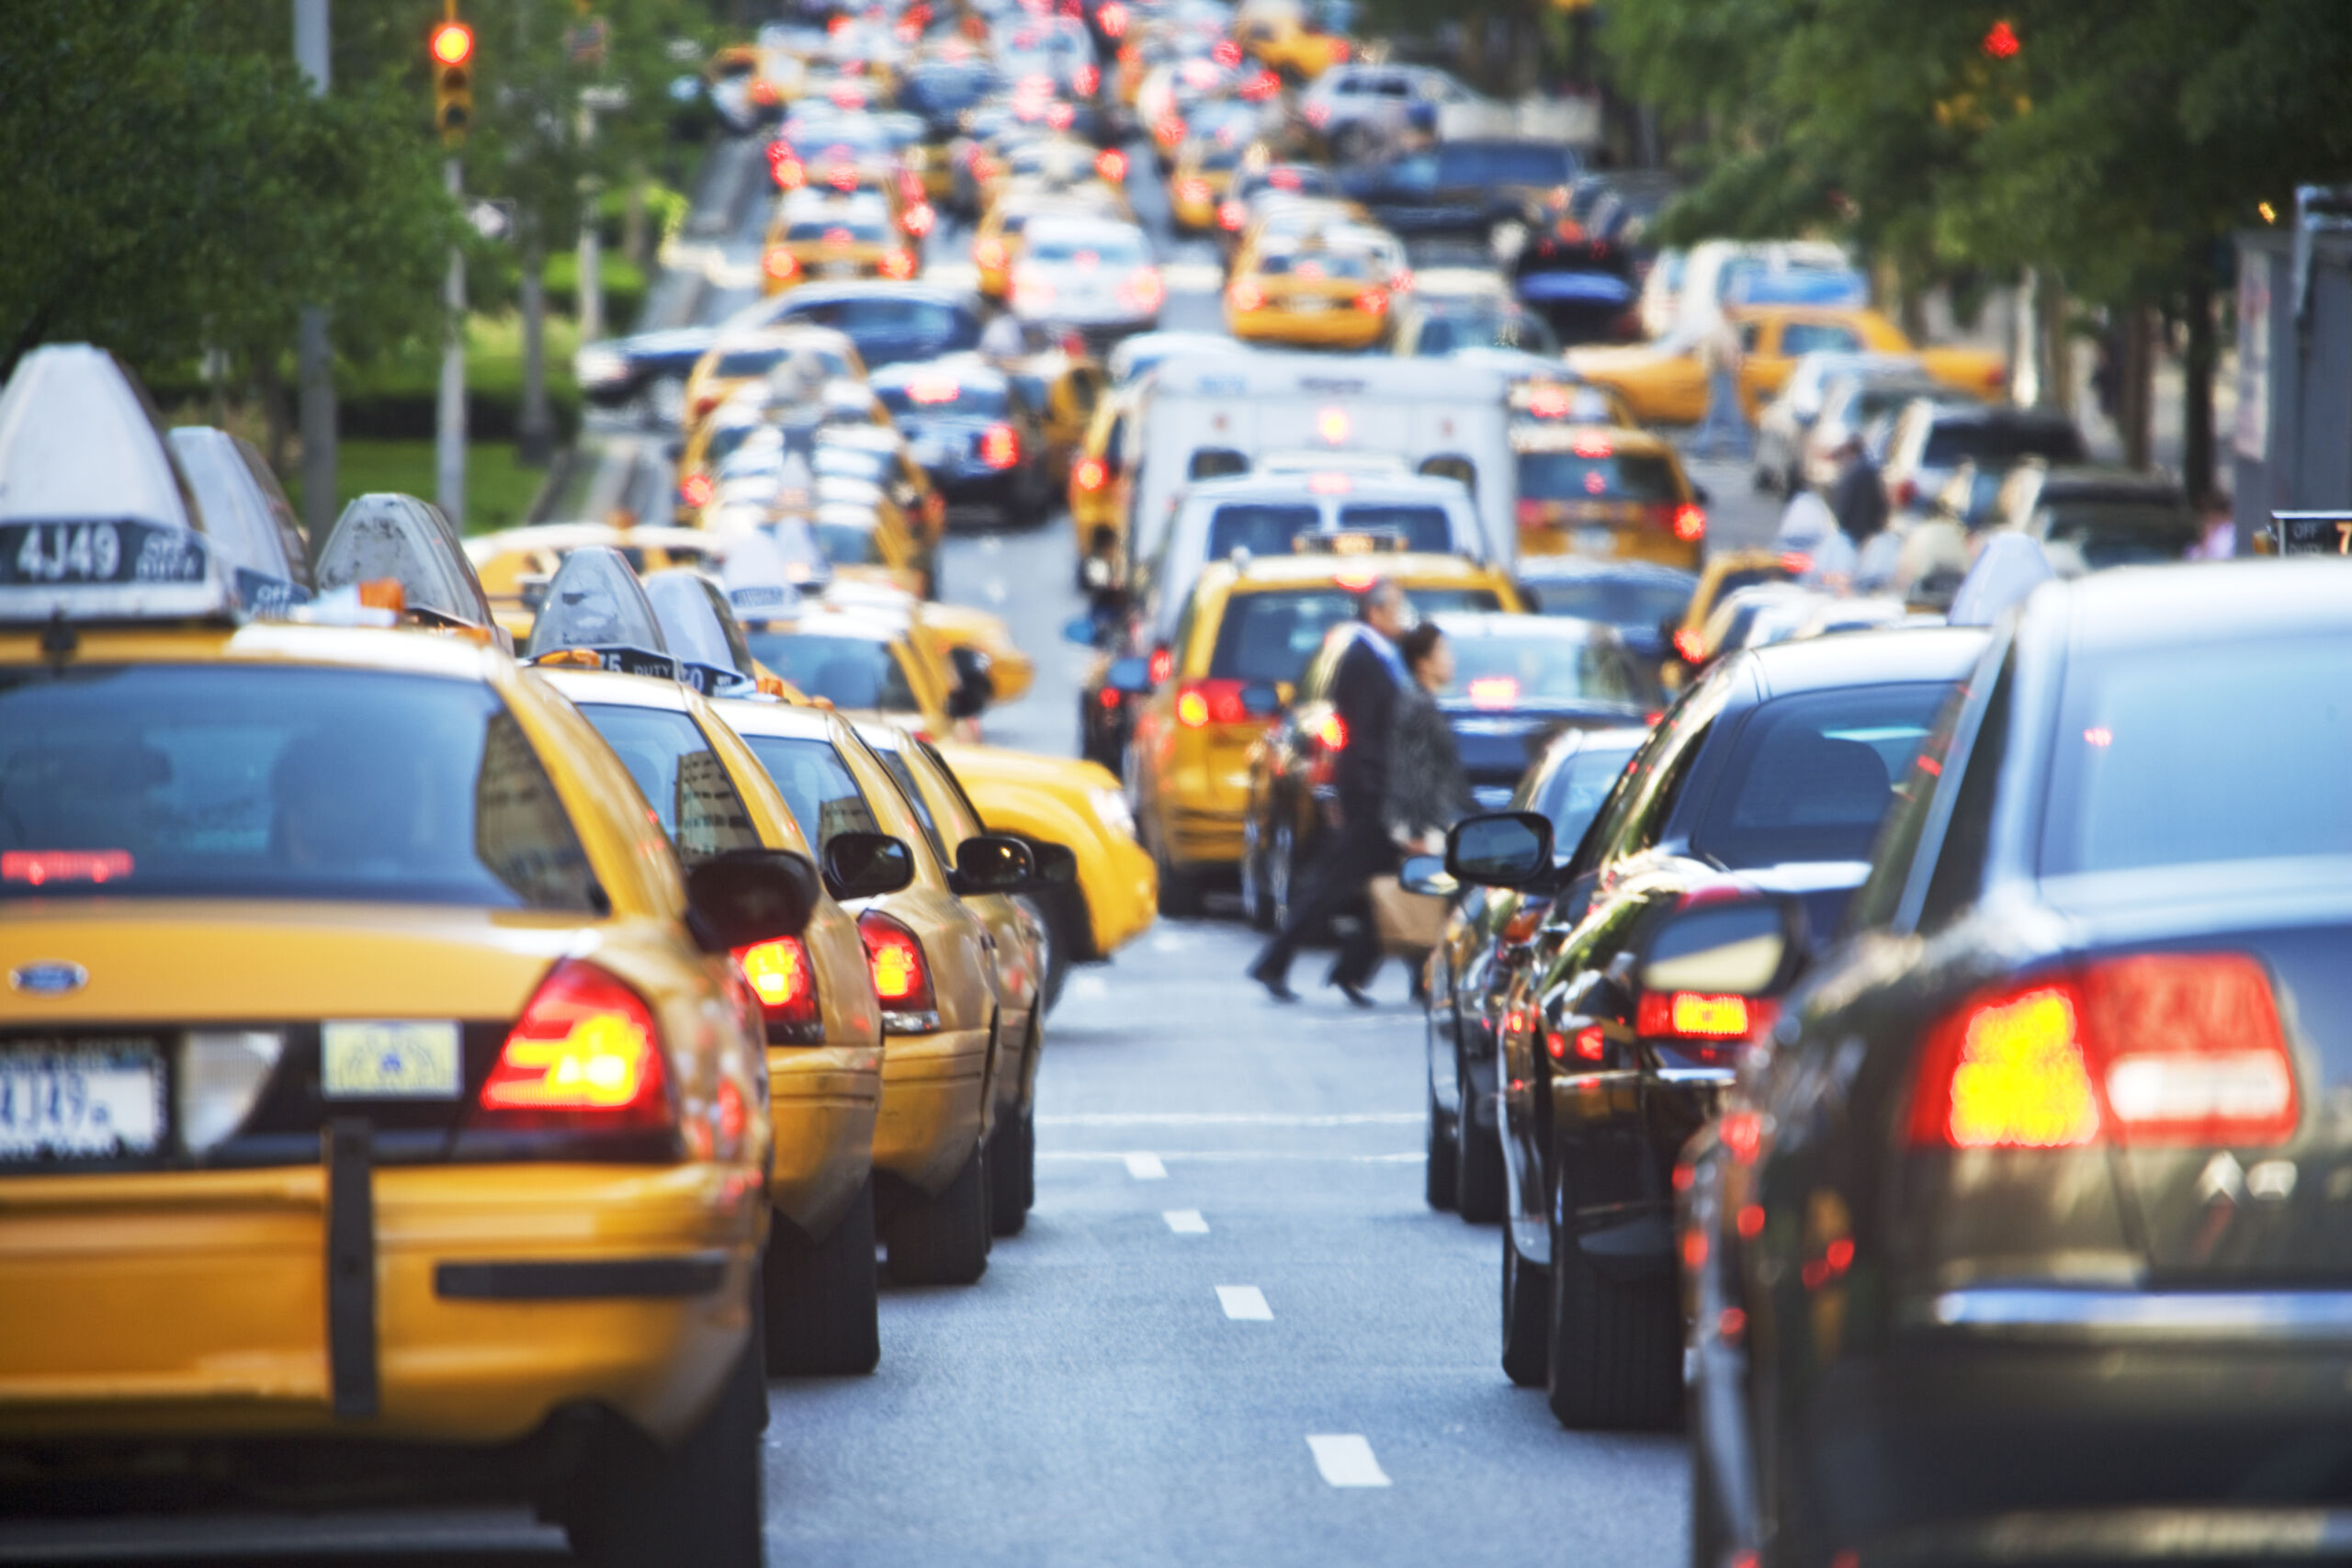
    Enlarge / New York City has the slowest car travel in the country. (credit: Alan Schein/Getty Images)

    Yet another annual traffic survey has found London firmly in first place— or worst place, perhaps —for 2022. This time it's TomTom's data that shows the Big Smoke is hell on wheels, with an average travel time of more than 35 minutes to go six miles (10 km) last year. Instead of just releasing a static report, TomTom has used its data to create a tool that lets you calculate the costs of commuting in 389 cities and their metropolitan areas, from A Coruña in Spain to Zwolle in the Netherlands, with 80 US cities in between.

    Of course, the 2022 data is worth a look. Here in the US , TomTom's trends show my own city of Washington, DC, did pretty badly over the past 12 months—the time to travel six miles went up by a minute and a half to 21 minutes. Indianapolis saw travel times also grow by 90 seconds year on year, but you could complete those six miles in 14 minutes, according to TomTom's data.

    As you might expect, transit-friendly New York City had the longest travel times to go six miles—25 minutes, which was an increase of 70 seconds over 2021. And New Yorkers spent the most time in rush hour during 2022, a total of 236 hours. (DC, in second place, lost 196 hours.)

    Read 3 remaining paragraphs | Comments

    • chevron_right

      Here’s where traffic sucked the most in 2022

      news.movim.eu / ArsTechnica · Tuesday, 10 January, 2023 - 17:11 · 1 minute

    Traffic on the Kennedy Expressway in Chicago at dusk, with the downtown skyline behind.

    Enlarge (credit: Getty Images)

    Did your commute get worse in 2022? Overall, congestion cost the country more than $81 billion, says transportation data company Inrix. It just published its Global Traffic Scorecard for the past year, and the data says the typical US driver spent 51 hours in traffic last year, 15 hours more than in 2021. And due to increased fuel prices and other inflation, the average driver paid $134 more for fuel last year than the year before—and that's in addition to $869 in lost time.

    Although it's not as severe as it was in 2020 or 2021 , it's still possible to see the effect of the pandemic in Inrix's data. In the US, vehicle miles traveled (VMT) increased by 1 percent year-on-year, but we still drove 9 percent fewer miles per year than before the pandemic. Interestingly, Inrix says this is due to more people continuing to work from home, which it says now accounts for 17.9 percent of Americans—before the pandemic, work from home accounted for only 5.7 percent of workers, according to the US Census Bureau.

    Sadly, road safety is still rather abysmal; the estimated fatality rate of 1.27 deaths per 100 million VMT is 17 percent higher than we saw in 2019, although there has been a slight reduction from 2021's high of 1.3 fatalities per 100 million VMT. And while some of the other trends found in the report exist in countries like the UK or Germany, the rise in road deaths appears to be unique to the US.

    Read 5 remaining paragraphs | Comments